Mystery Solved: Complete correlation between S55 Dyno's, Simulations, and real-world
There have been a lot of questions on the forums about initial dyno numbers for the F8x M3/M4 and the new S55 engine. Some say it's underrated, others say the dyno's are wrong. Yet others use CarTest simulators to "prove" the dyno's are wrong instead of using real-world results to see if their simulations are right. Here at P1 Motorcars, we wanted to take a stab at this question ourselves. We believe we can do it, and here's why: we've done this before, we have the data, AND we have the expertise to put together an accurate simulation model. As far as we can tell, most people talking about this have been talking themselves in circles and haven't done the type of work we're planning to put into this.
We got curious when we noticed so many people have dyno'd the stock M3/M4 on a Dynojet and most of them seem to get about the same results. Talking to Steve Dinan, he mocked these dynos saying they were figments of the imagination to think BMW underrated the engine by so much. Then we read an article using the CarTest simulator to "prove" the dyno's were wrong. So we wondered if their simulations were accurate, why they never tried to check them against real-world data or why they never tried to check the real-world data and see how much horsepower is needed to get there. We wondered if our models would prove the same thing. All we need is some dyno's and vBox results for the same car and a few hours of our time to create the simulation models and compare the results. At least, that's how this all got started. It ended up much more complicated than that.
Using our prior work as our model, we knew we could create an accurate CarTest model would be at least as accurate as any of their attempts, and most likely more accurate; so we decided to give it a try. Obviously if our results came to the same conclusion, there would be no need to write this article or spend so much time on it. But our results were quite different. So we kept digging and getting more data points until we were satisfied that our results were better than the previous attempts.
So we thought Terry Burger's M3 would be the perfect car for these experiments. Terry has an F80 M3 with dynos in the dyno database and vBox results in the vboxtools.com database. Terry ran stock dynos, and JB4 tuned dynos, then he went out and ran vBox results for both. So we have two full sets of data we can use to compare against CarTest. It may be only one data point, but it's better than the prior analysis that didn't have any data points.
I'll break this up into a few different parts. Part-1) Establish the baselines for the article. Part-2) Show how we create a very accurate CarTest simulation model. Part-3) Comparing CarTest, vBox, and Published results. Part-4) Reverse-correlate Dynojet results by generating vBox dyno's. That's where we can run the vBox results through physics based calculators to tell us how much wheel horsepower the car produced at that moment. Buckle up...because here we go.
Part-1: Reference Dyno, vBox, and Published Results:
We chose two types of dyno's for our reference. 1) Dynojet SAE Corrected. We chose Dynojet because of our prior experience and success correlating Dynojet results with CarTest simulations to obtain highly accurate real-world results. We've modeled at least six or more cars in CarTest using our techniques and always obtain very accurate real-world results. 2) Maha Rolling Road dyno, SAE Corrected. The Maha is purported to be the most accurate dyno and can calculate drive train losses to obtain an estimate for crank horsepower. We've never tried to use a Maha dyno in CarTest before, but it seemed like a good candidate because it gives an estimate of crank horsepower instead of wheel horsepower. This seems like a good candidate to try as well.
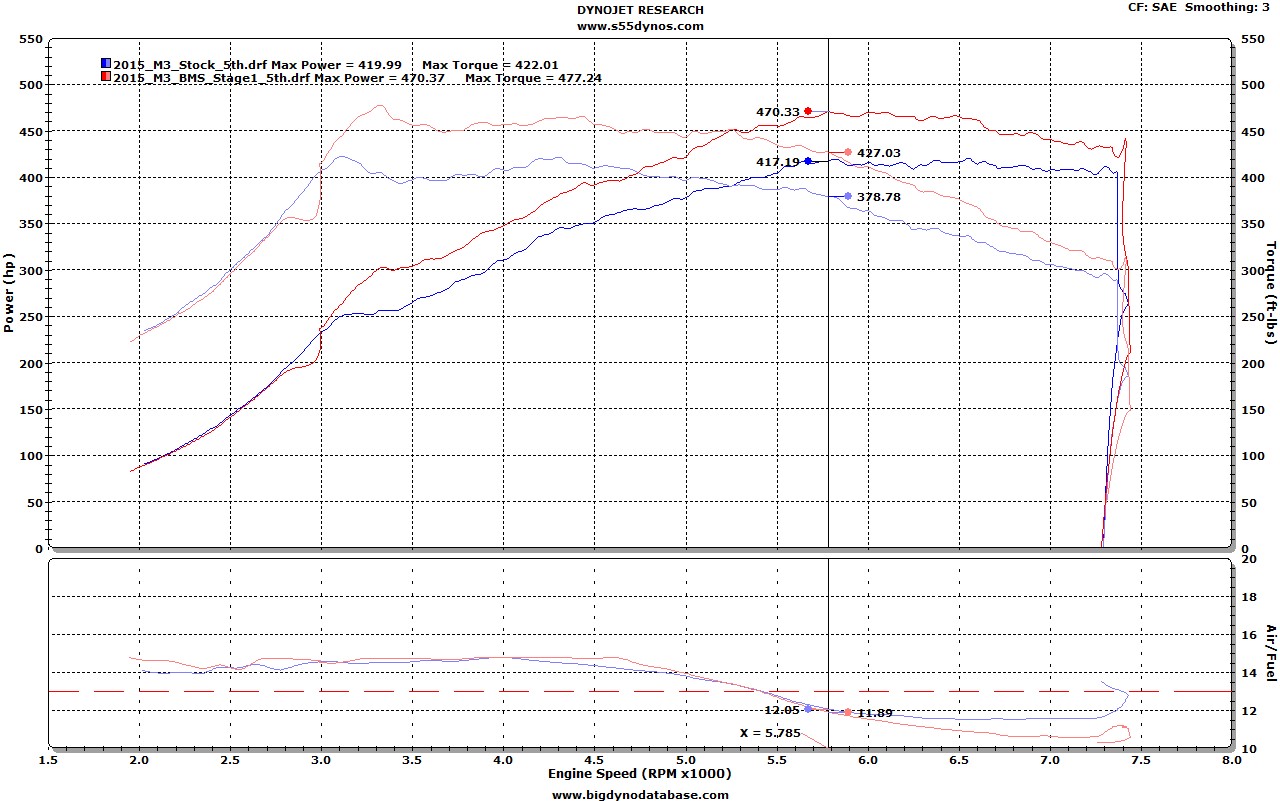
Our Dynojet reference dyno and vBox were results taken from the dyno database and vboxtools.com database respectively. These are the reference results we're going to try to match up with CarTest simulations, then at the end use our "vBox Dyno" to reverse the process to see if the vBox wheel horsepower matches our Dynojet results. Both stock and JB4-tuned results are on the same dyno chart. Our Maha reference dyno was taken straight from
this car forum thread.
Since we're only interested in horsepower, this article will only concentrate on the vBox results that show the effects of horsepower: namely 1/4 mile terminal velocity (vMax), 1/4 mile trap speed, and 60-130 MPH results. These are our baselines.
DynoJet results for Stock and JB4 Tuned
 Maha results for Stock
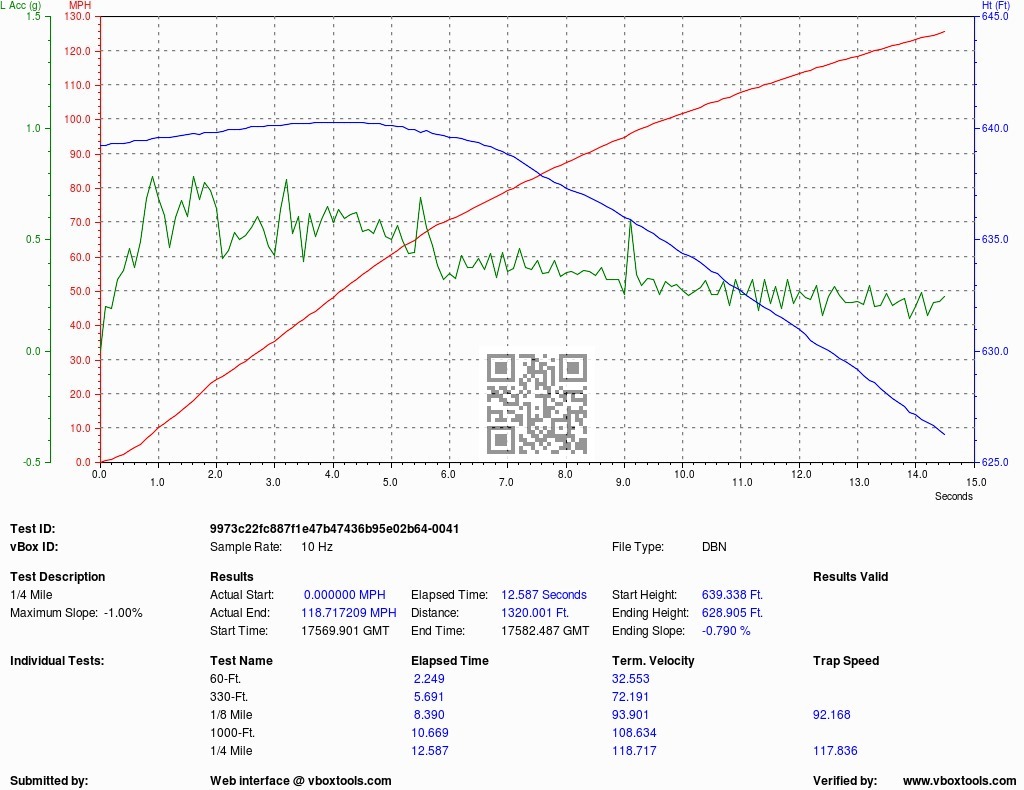
 Stock: vBox 1/4 Mile (STOCK):
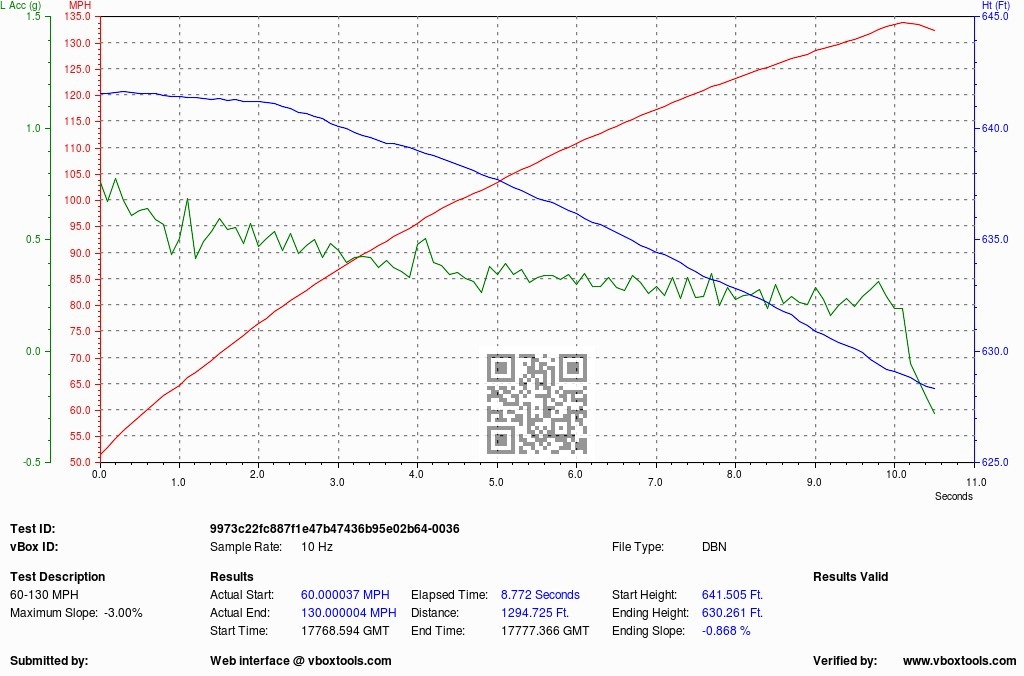
 JB4-Tuned: vBox 60-130 MPH
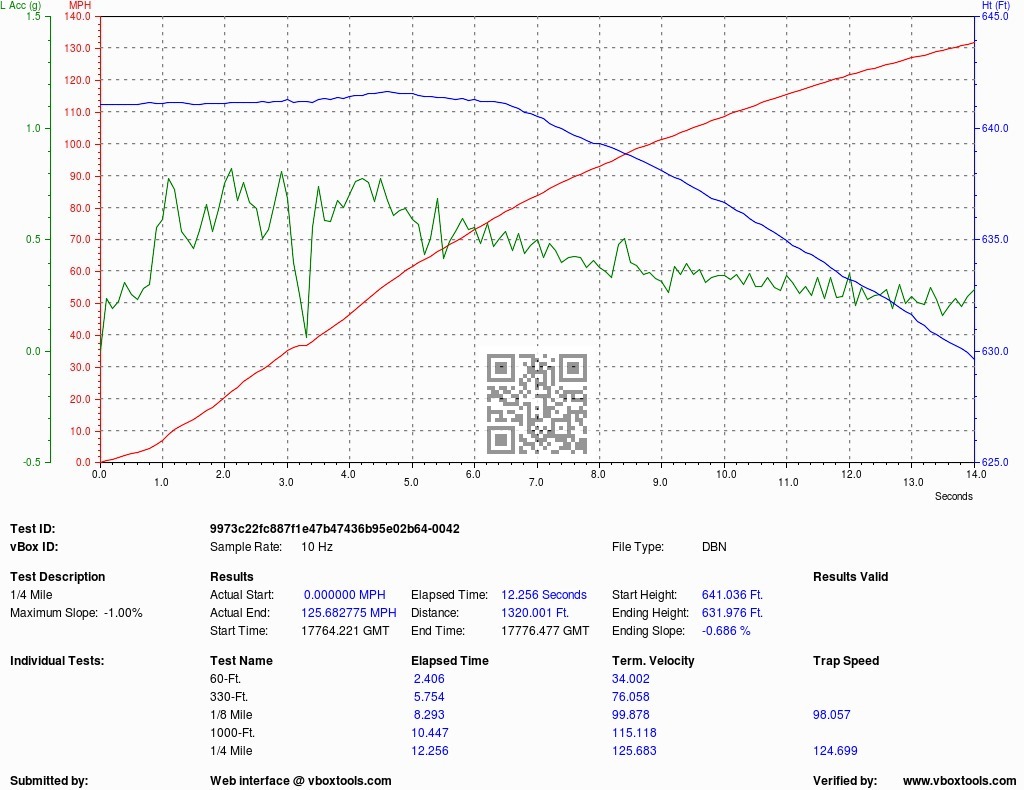
 JB4-Tuned: vBox 1/4 Mile
 Published Results
We think it's nice to know how our vBox results line up with published magazine results. That's going to tell us if we're chasing an outlier or an average M3. This is an important step because we have dyno and vBox results for the same car. If our 1/4 trap speed is an outlier, then it may mean our dyno results are an outlier too. Our methods would still be valid, but we think it's important to know if our car is an outlier or not because so many dyno's keep popping up with very similar values.
BMW M4 M-DCT: 12.1 s @ 119 mph (Car and Driver)
BMW M4 M-DCT: 12.1 s @ 119.1 mph (Motor Trend)
BMW M3 M-DCT: 12.1 s @ 117.8 mph (Motor Trend)
BMW M3 M-DCT: 12.6 s @ 117.8 mph (Terry Berger, vBox Trap Speed)
Now we know we're not chasing an outlier. Our car is very average and gave the same exact results as Motor Trend. And since so many dyno's keep showing up with very similar results, that's a pretty good sign that our dyno's are just as average as well.
Part-2: Create the CarTest Model
Here at P1 Motorcars, we have extensive CarTest experience. We've generated models so accurate, our methods usually produce simulations within a few tenths of a second or few tenths of a MPH of real-world results. But in order to get this accurate, your CarTest model must model everything that happened in the real-world and on the street. If you don't model the real-world conditions, then you can't expect CarTest to match your real-world results. It's the old adage: "garbage in equals garbage out." So we start with the actual car dyno's, then add the real-world conditions the car ran on the street.
We start by filling in every field that we can reasonably measure or calculate, and we leave the rest alone. I will show every setting we used for CarTest, except two settings we consider proprietary. I'll point those out as we go. We used a combination of BMW published data, and actual car measurements for our CarTest model. Our basic model looks like this:
Basic CarTest Model:- Weight: 3578 lbs. (Measured)
- Weight distribution: 52.639% front (measured)
- Wheel weight 49.85 lbs. (measured)
- Wheelbase: 110.7 inches (BMW published)
- Tires: 275-40-18 (Stock, BMW published)
- Tire Pressure: 38 PSI (measured)
- Coefficient of Rolling Resistance: Proprietary, but uses well known physics formula and tire pressure to calculate this value.
- Drag coefficient: 0.34 (BMW published)
- Frontal area: 24.65 sq-ft (BMW published)
- Height: 56.0 inches (BMW published)
- Width: 73.9 inches (BMW published)
- Ground clearance: 4.72 inches (BMW published)
- DCT shift speed: Proprietary. Based on actual measurements.
- Driver weight: 175 lbs.
- Weight of fuel: 30 lbs.
Note about wheel weight measurements: This is one area CarTest doesn't do a very good job. In order to calculate a truly accurate model that approximates the effects of wheel weight (the notion of "equivalent mass"), the wheels and tires must be weighed separately, and their respective weight distributions must be known. CarTest lumps this all into a single calculation based on whatever assumptions it makes on its own about weight distribution. CarTest doesn't account for different front and rear tire sizes and weights either.
Adding DynoJet Dyno Results to our model
Using this basic model, we branched our CarTest model into three categories: 1) Bone stock Dynojet, 2) Bone stock Maha, and 3) Burger JB4-tuned. From there, we downloaded the dyno files from the dyno database, and input the numbers directly into CarTest. We didn't introduce errors by using approximated or digitized results where we didn't have to, we used the actual data from the dyno files themselves. CarTest documentation instructs us to use SAE corrected results when we use the "Driving Wheels" power for our simulations. So that's what we did.
Adding Maha Dyno Results to our model
Since Maha dyno's are regarded as some of the most accurate AND have the ability to calculate drivetrain losses, we decided to add a set of Maha dyno results to a separate CarTest branch model. Using the same parameters as our stock vehicle, but substituting the Maha dyno results from the crankshaft instead of wheels, we input these results into CarTest.
We can't download the Maha results like we can the Dynojet results. To capture these values, we used a very advanced and accurate method to digitize this graph that programmatically converts the graph into a series of (X,Y) coordinates (1). This method has been used to digitize reluctant vendor dyno's for the Dyno Database; it's dead accurate. The graph shows "P-Mot[PS]" results which are not SAE corrected, and not reported as horsepower. (The Maha dyno shows "P-Norm[PS]" graphs for SAE corrected; P-Mot is always uncorrected.) So using the published weather data, we applied the SAE correction formula to the dyno data we generated, and converted from PS to HP. We then input these values into the CarTest simulator.
Adding Weather to our model:
To create a fully accurate model, we also need to capture the actual weather data because it affects performance. This is going to be tricky because there would appear no way to capture this data. That is until you realize the vBox file has everything in it to figure out the weather. The vBox file doesn't have the actual weather data, but it does have two very important pieces of information that can help us figure it out: GPS coordinates, and GPS timestamp. Here's how we converted those two pieces of information into actual weather data.
Step-1: Look up GPS coordinates on Google Earth. That would be fine if we had access to the vBox files...but we don't. We had to beg for it, and we were only given a single GPS coordinate. It's better than nothing, and in fact it's all we really need.
Step-2: Use NOAA database to find a nearby weather station. We found a weather station almost right on top of the GPS coordinate we received. And best of all, it was a high resolution, high data rate weather station and reported results every five minutes. Perfect!
Step-3: Convert GPS timestamp to local time. That's not as easy as it sounds. The verified vBox results show the GPS timestamp. First you must convert the GPS timestamp to a UTC timestamp, then convert UTC time to GMT, then convert GMT to seasonally-adjusted local time. So that's what we did.
Step-4: Now that we know exactly when and where the vBox file was generated, we can look up weather data in NOAA database for that exact location, date, and time. As luck would have it, the NOAA database contained entries for these exact timestamps.
Step-5: Not related to timestamps, but capture the slope of the vBox runs from the verified and published vBox results.
But wait...there's more! What about wind? The NOAA weather station does show wind velocity and a very rough idea of direction. We could do some vector math to convert this data to headwind/tailwind if we knew what direction the car was headed. But with a single GPS coordinate, we don't. So we had to call our data guy and ask. After he gave us the heading, we did the math based on NOAA wind speed and calculated how much headwind/tailwind was on the car at the time.
Enter all of this back into CarTest.
Weather (stock vBox runs):- Temperature: 75.6 deg-F
- Pressure: 29.76 in-Hg
- Humidity: 51.0 %
- Wind: +2.0 MPH (Headwind)
- Slope: -0.790 %
Weather (JB4 tuned vBox runs):- Temperature: 74.5 deg-F
- Pressure: 29.76 in-Hg
- Humidity: 52.0 %
- Wind: -3.5 MPH (Tailwind)
- Slope: -0.686
Drive train losses:
When you use CarTest to simulate based on wheel dyno results, it bypasses the drive train losses entered into the program. But when simulating based on engine dyno results, it doesn't. So we don't need this for the Dynojet, but we do need it for the Maha results. We entered the following drive train losses into CarTest and added the same 1-ft rollout to follow the vBox verification software model:
Losses:- 1% for auxiliaries
- 3% for the DCT
- 3% for the differential
- 3% for the axles and shafts (2)
- 10% Total
10% drive train loss might sound a little light, but here's the rationale. Rototest (RRI) dyno database tested the E9x/S65 motor and found approximately 12% drive train loss (3). I think it's a safe assumption that the DCT in the F8x M3 is at least as efficient as the DCT in the E9x M3; so let's start with the 12% loss inferred in the RRI testing. The F8x M3 has a carbon drive shaft and less rotating mass. So the losses for axles and shafts on the F8x M3 will be less than the 12% on the E9x M3. I chose 10% for this value.
That's our CarTest model along with actual dyno results from the dyno database. Now let's compare our CarTest results to actual vBox results to see how they stack up.
Part-3: Comparing CarTest, vBox, and Published Results:
These are the CarTest predictions. Following is a side-by-side comparison of the CarTest predictions and real-world published results.


Notice the stock Dynojet, Maha and CarTest simulations are right on the money with the real-world. This tells us that our CarTest model is pretty good. This is the same technique P1 Motorcars has always used to predict road and drag race performance with great success. We continue to find our CarTest models match our real-world results within a few tenths of a second, and few tenths of a MPH (4). We are satisfied with these results as they show the accuracy of our CarTest model.
The JB4 Tuned results show slower CarTest predictions vs. real-world vBox results. The difference was far enough that we were puzzled by it. We wondered if Terry Burger had "re-tuned" the JB4 between the Dynojet and the vBox. Terry confirmed this had been the case. So while JB4 tuned results aren't as near perfect as our stock results, we are satisfied with Terry's explanation that his re-tuning would account for this difference. At least CarTest didn't show faster results than real-world; if it had, we would be worried.
Part-4: Reverse-Correlating Dyno, CarTest, and vBox Results:
This is the part of the analysis that was the most fun for us at P1 Motorcars. So far we have matched the Dynojet results with CarTest simulations, and we have matched CarTest simulations with vBox results. Everything matches. But we can also reverse the process and regenerate the horsepower charts based on performance. There's a few ways we can do this: 1) Use one of the many vBox Dyno spreadsheets available. 2) Use Insoric RealSpeed road test module. 3) Use an automated vBox Dyno to reverse-calculate horsepower.
vBox Dyno Spreadsheets:
Over the years there have been a few different vBox Dyno spreadsheets posted on various forums. One of the best was done by 'spdu4ea' on e46fanatics. PencilGeek started with his work, refined it, fixed some bugs, and republished it in both Microsoft Excel and OpenOffice spreadsheets. It's clumsy, but models many of the most important forces acting on the car. But it doesn't model all of them. These two important forces are missing: rolling resistance and wheel weight ("equivalent mass") calculations. We tried it anyways and the vBox dyno spreadsheet gave us 385 whp even though it was missing two very important pieces of the puzzle. Horsepower can only go up from here, so we kept looking.
Insoric RealPower Road Testing:
Recently the Swiss company Insoric came to our attention with a brilliantly conceived device that attaches to your wheel, captures acceleration and deceleration, and converts this data into wheel horsepower and crank horsepower. Their idea to calculate crank horsepower based on measuring drivetrain losses through physics equations of wind and rolling resistance is simply brilliant.
Here at P1 Motorcars we were so intrigued by this idea we immediately contacted Insoric to ask if we could become their US Distributor.
Here's video demonstrating their brilliant concept.
This video and the concept looked so good, we immediately fired off a series of emails to get more technical details. Here's what they told us and can be seen from their documentation:
Input Parameters:
- Velocity capture: Captured from Gyroscope and Accelerometer (not GPS -- huh?)!
- Sampling Rate: 10 Hz (equal to vBox, but less accurate without a GPS).
- Wheel Diameter (circumference or diameter, measured or calculated)
- Max RPM (user supplied)
- Gear Ratio (calculated from Wheel Diameter, velocity, and Max RPM).
- Wheel weight (user input without any notion of weight distribution)
- Barometric Pressure (user input)
- Temperature (user input)
Insoric RealSpeed will report wheel horsepower, crank horsepower, both uncorrected and SAE/STD/ corrected. It sounds like a brilliant idea...right? Yes it is a brilliant idea, but the execution of the idea has many oversights that will affect the accuracy of the results.
Look what's missing:
- Let's start with capturing velocity: Using a gyroscope and accelerometer to capture and approximate velocity isn't accurate. At the end of the day, it's just an approximation. This is exactly how your BMW Performance Steering wheel works. It's never going to be accurate compared to using a GPS that can capture velocity within a few hundredths of a MPH.
- SAE/STD/DIN correction.: All of the horsepower correction formulae require temperature, barometer, and humidity (or wet-bulb/dry-bulb). Humidity is missing from the input parameters. Their correction equations will never be accurate.
- Calculating losses due to wheel weight ("equivalent mass"): Like CarTest, Insoric has a one-size-fits-all approach to calculating wheel losses. They don't have separate input for front/rear tires, and they always seem to assume four wheels (no big deal, just pointing it out). To get more accurate calculations, one would like to know the wheel and tire dimensions, along with approximate weight distributions for each.
- Calculating losses due to aerodynamics: Without frontal area and drag coefficient, these losses can't be calculated. Insoric RealSpeed doesn't seem to account for this very significant force.
- Calculating losses due to rolling resistance: This is another of those areas where Insoric dropped the ball. The best physics-based calculations here require tire pressure, and for Insoric that is missing.
- Calculating losses (or increases) due to slope. Insoric says to run their product on a flat road or else it's not accurate. Without a GPS, you don't have this data. So just stay on a flat road when testing.
These are some very significant deficiencies in the Insoric RealPower product that will affect its accuracy. No matter how brilliant the idea, it's clearly not going to be nearly accurate enough. But here's the real rub from Insoric. Based on the hardware they described, Insoric RealPower should be cheap: maybe $100 - $200, $500 at the most. But the Insoric RealPower comes with a hefty $5200 USD price tag. That's right, $5200 for an electronic gyroscope/accelerometer ($2.00), a microcontroller ($4.00), and SD card writer ($4.00). With packaging, I doubt there's more than $20 bill of materials on the device itself, but it carries a $5200 USD price tag. That's definitely not worth it. No matter how brilliant an idea, the execution is poor and the price is too high. Let's keep looking.
Automated vBox Dyno:
The same program from vboxtools.com above has an undocumented ability to calculate and display a vBox Dyno. This isn't a big secret, the capability is listed on his web site, but he doesn't tell you how to use it -- so we asked. The vBox Dyno is undocumented because there's no user interface to input all of the required input data. Maybe someday the author will add it, but for now we had to provide the data and ask the author to run the vBox Dyno to generate the graphs for us. The program uses well known and documented physics equations to calculate wheel horsepower of the car in motion.
Calculations:
- WHP due to Acceleration
- WHP due to Slope
- WHP due to Friction (rolling resistance)
- WHP due to Aerodynamic drag (wind resistance)
- WHP due to wheel weight (equivalent mass)
Inputs:
- Tires: Size as MMM-RR-DD
- Tires: Pressure PSI
- Tires: Number of tires (currently all wheels/tires are assumed the same...DING)
- Tires: Tire weight
- Tires: Tire weight distribution
- Tires: Wheel weight
- Tires: Wheel weight distribution
- Vehicle: Vehicle weight
- Vehicle: Driver weight
- Vehicle: Gasoline weight
- Vehicle: Weight distribution (front/rear)
- Vehicle: Frontal area
- Vehicle: Drag coefficient
- Weather: Temperature
- Weather: Pressure
- Weather: Humidity
- VBox: Velocity
- VBox: Height/Slope
- Math: All the rest is just math.
Remember what we said at the beginning: garbage in equals garbage out. If you want accurate results, you start with accurate data. That might seem like a lot of data to collect, but it really isn't. At P1 Motorcars, it only took us a few minutes to gather the missing pieces of data because +90% of it was already in our CarTest simulation model. These are the results.
vBox Dyno Results: 1,4 Mile, Stock
 vBox Dyno Results: 1/4 Mile, JB4-Tuned
 vBox Dyno Results: 60-130 MPH, JB4-Tuned

These vBox Dyno's are stunning matches for our Dynojet results. The stock vBox Dyno shows a solid 420 whp -- exactly what our Dynojet results showed. The JB4 Tuned results show an equally solid 485-490 whp with peaks over 500 whp. This confirms Terry's account of adding additional tuning after the original dyno session and explains our CarTest simulation underestimating the JB4 Tuned results.
Conclusions:
All of the dyno's and vBox results we presented came from public sources. Our entire CarTest model was taken from actual measurements on the real cars or from BMW published specifications. We didn't pull anything out of thin air...we didn't need to. Anybody can do what we did exactly as we described it and they should get exactly the same results. We can't explain why the previous CarTest models didn't produce results that match the real-world. But we do know that our P1 Motorcar simulations do match real-world results, as they always seem to. We think we're on to something here.
We started with a single goal: to see for ourselves if the S55 dyno's could be explained; were the previous simulations results real or faulty? Our curiosity piqued when we identified what we thought were two significant flaws in the original article: 1) The author repeatedly uses himself as his own reference or "proof" of something. That's not how science is performed. 2) When the author tried to mimic our P1 Motorcars "real-world" approach, he reported simulations 3-4 MPH higher than the real-world. But instead of suspecting fault in his own simulation models, he continued to have overconfidence in his CarTest model and believed the simulations were right...and the dyno's were wrong. Again, not very scientific.
Our simulation models showed completely different results and ours perfectly matched the real-world. We followed our well established simulation model and did the same thing we've done many times before on many other Dynojet simulations. We ended up with simulations that perfectly matched real-world vBox and Car & Driver tests. Then we added the Maha dyno results for giggles, and even though they were crank horsepower, we added the missing SAE correction, converted from PS to HP, and our simulation results still perfectly matched our vBox results. Our first conclusion: the prior simulation models were wrong and that's why their results were wrong too.
Our simulations matched real-world vBox results within 1/10th of a MPH for both vMax and trap speed. Afterwards, we reversed the process to calculate horsepower based on the vBox data. Surely if the Dynojet results were far off, the vBox dyno's would show just how far off they would be. But instead, the vBox dyno results verified the same power levels seen on the Dynojet results. The stock vBox dyno results matched the Dynojet almost exactly. The JB4-Tuned results showed a little higher. But as Terry explained, the JB4 tune was tweaked after the dyno and before the vBox runs. So our second conclusion is the vBox dyno's don't show anything different than our Dynojet results. And this leads us to our third and final conclusion: the Dynojet results are indeed real. Dynojet results are confirmed by simulation. The simulation is confirmed by the vBox and published trials. The vBox is confirmed by the vBox dyno -- which matches the Dynojet almost perfectly.
There's no mystery here. The mystery is solved. The Dynojet numbers are real, and this is the performance you can expect on the dyno, on the simulation, on the street, and on the vBox dyno. Everything seems to match and there doesn't appear to be any consistencies. Case closed...for now.
Notes:
(1) Instruction video for converting graphs to (X,Y) coordinates may be
found here.
(2) We chose 3% axles losses instead of 5% due to the lighter (carbon fiber) axles on the vehicle.
(3) Compared to BMW published dyno figures.
(4) Terry Burger published an account of his tests where he described his launch as a "soft launch." This would account for a wider error margin in elapsed time vs. simulations, while keeping much closer error margins for the trap speed.