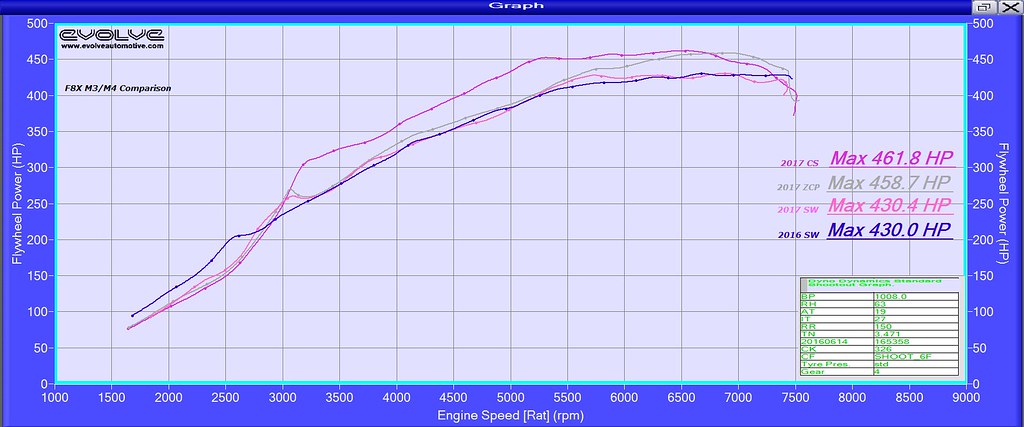
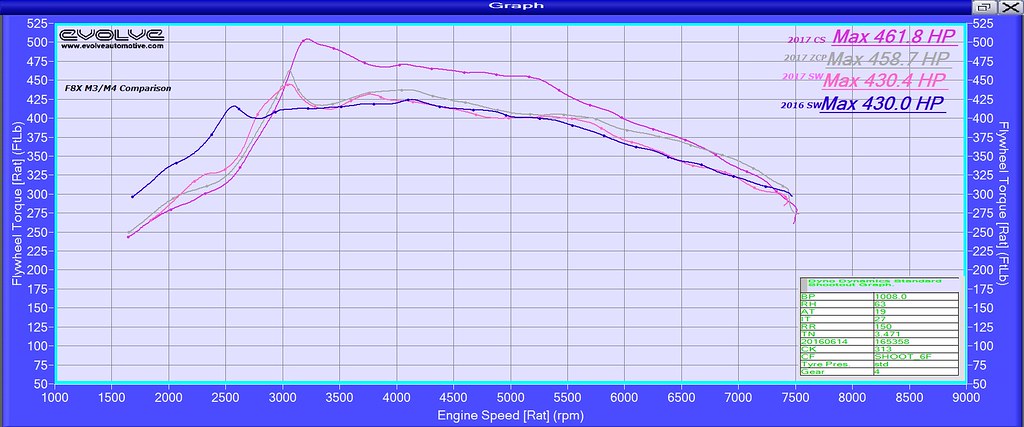
We thought it would be useful to show the differences between different OE software on this platform on one graph. We have split this into BHP and Torque (flywheel) to make reading it easier.
As you can see the 2016 (and earlier software) had more power/torque low down. BMW then reigned this in at the lower RPM's to help with traction and drivability on the newer stock software and carried this through on the ZCP and CS software. We were surprised by the power/torque increase the CS has over the ZCP.
The ZCP vs CS was tested on our development car (2017 ZCP) back to back. Its only just had its run in service done at 900 miles so we will test again after a few 100 miles more to see if it still tails off at the top end.
BHP
Torque
AFR
