

| 12-22-2016, 07:15 PM | #1 |
|
Major
 1009
Rep 1,388
Posts |
♒ TWO Dynos - HEX Tuning ♒
There's a difference between measuring power, and measuring performance. TWO Dynos  Underneath the X6M is our Mustang MD-AWD-500 dynamometer. 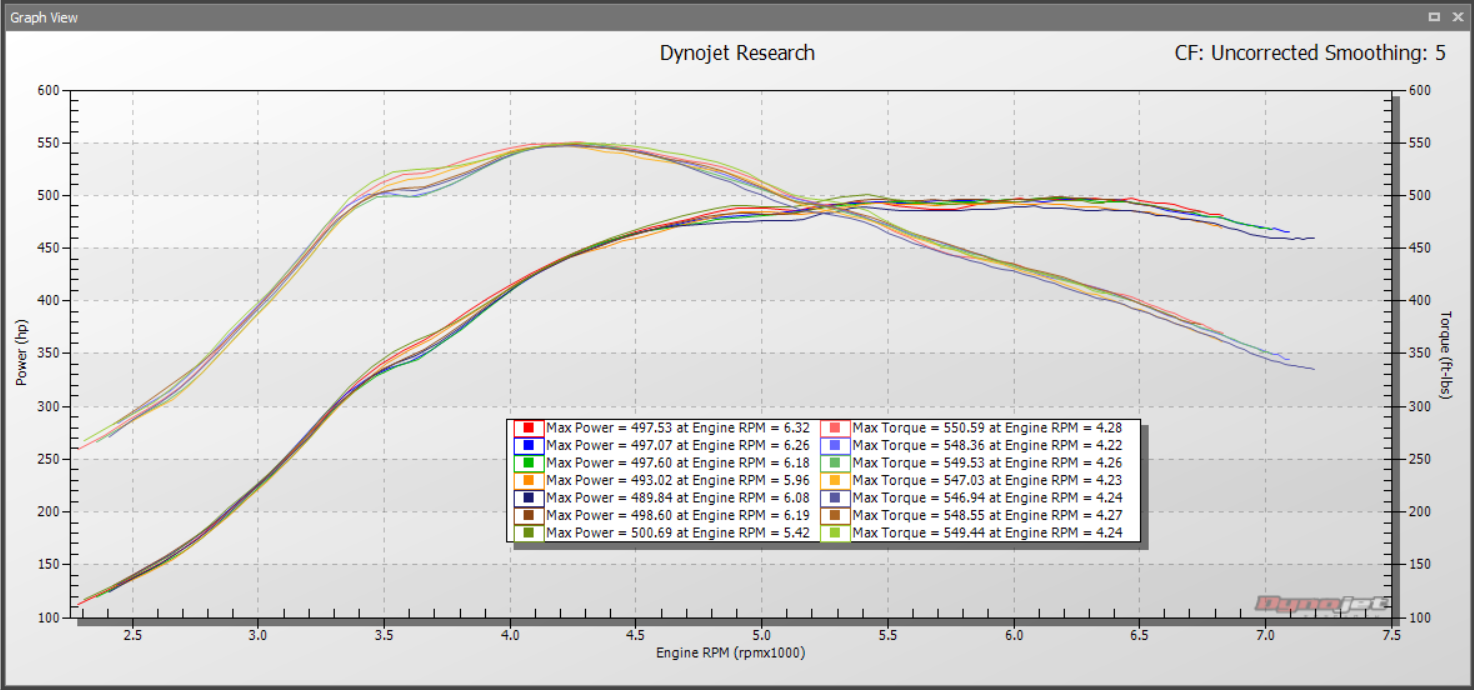 Reading the results. Stage ONE - STD Correction | Smoothing 0 - 486HP 529TQ 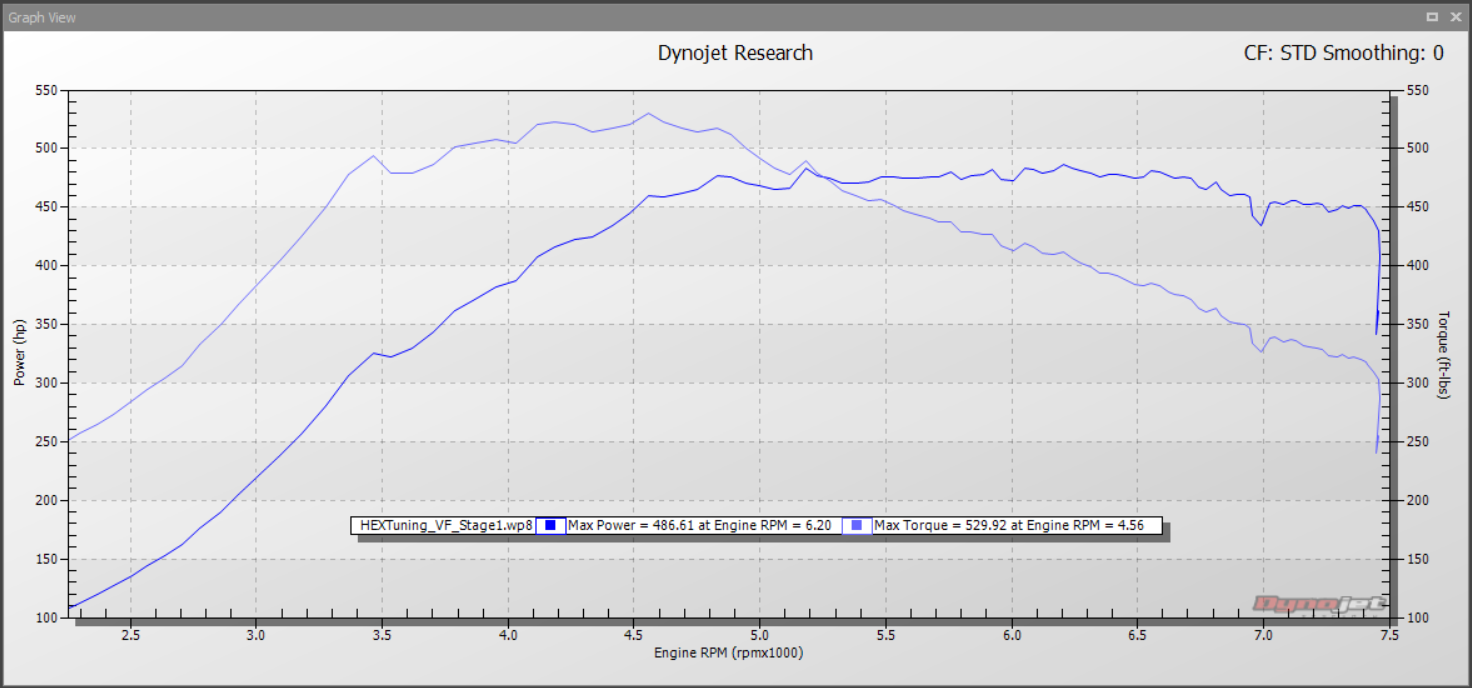 Stage ONE - STD Correction | Smoothing 5 - 482HP 521TQ 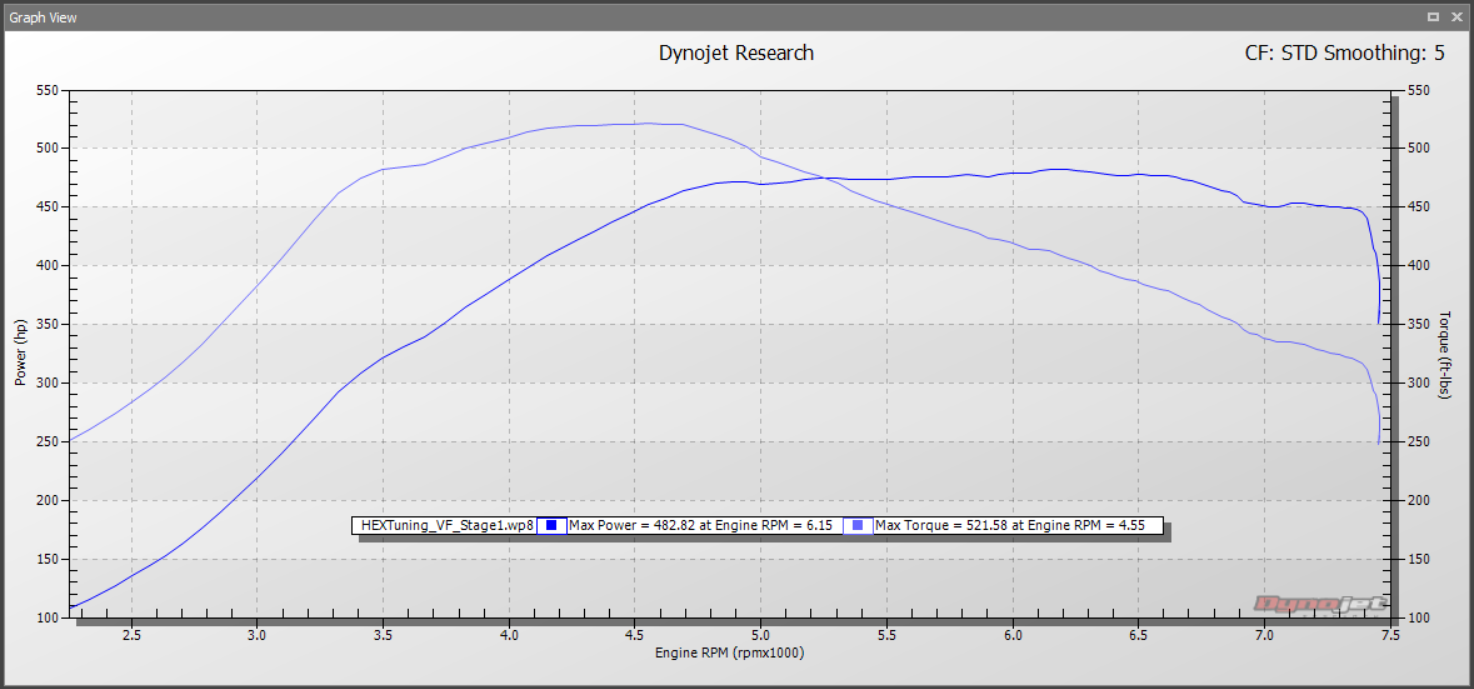 Stage ONE - Uncorrected | Smoothing 5 - 472HP 510TQ 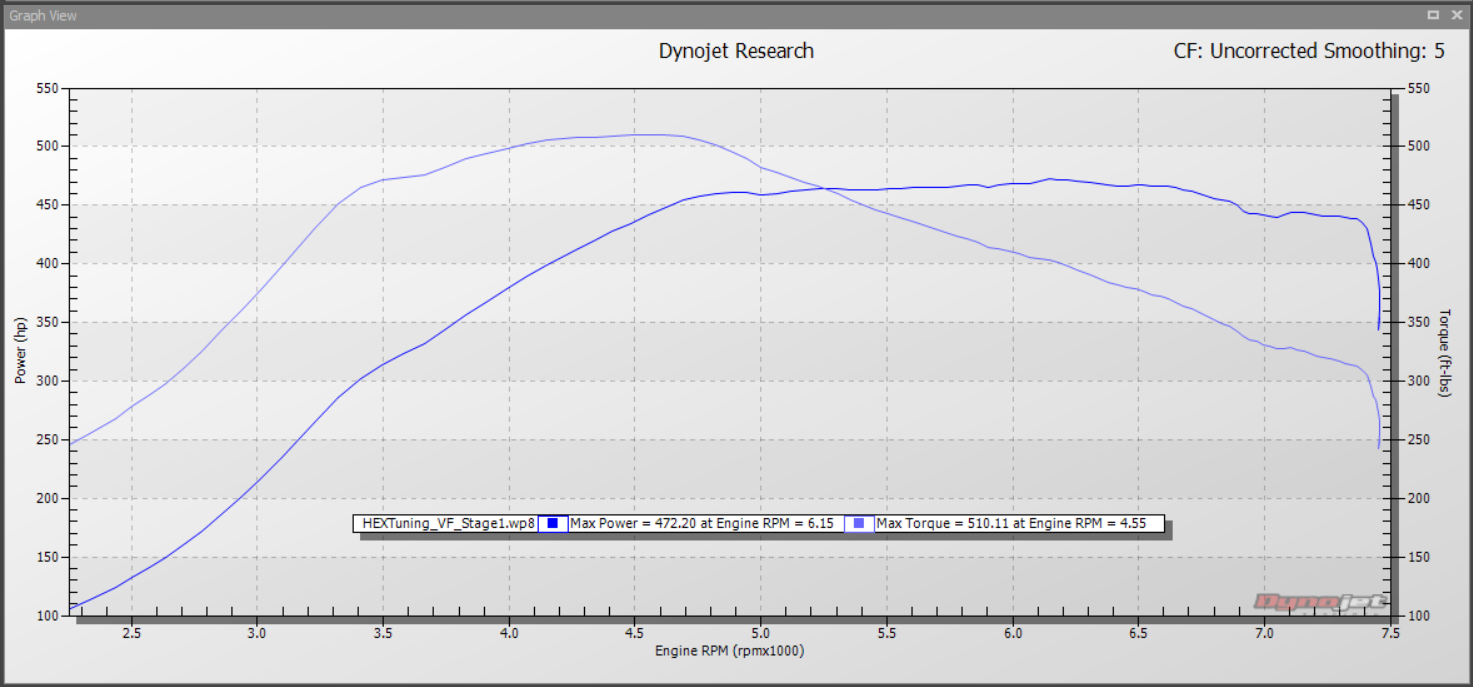 Stage ONE - SAE Correction | Smoothing 5 - 471HP 509TQ 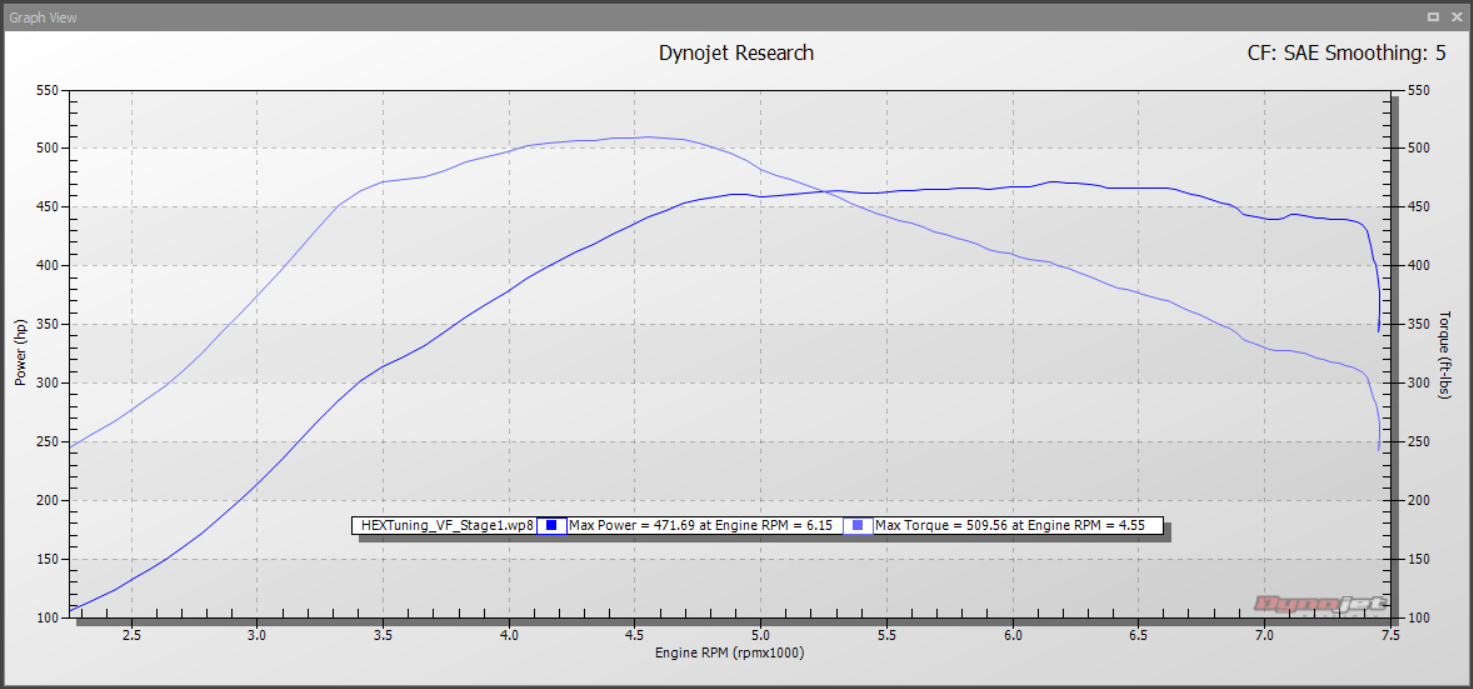
Stock vs. Stage ONE - Unorrected | Smoothing 5 - +64HP +98TQ 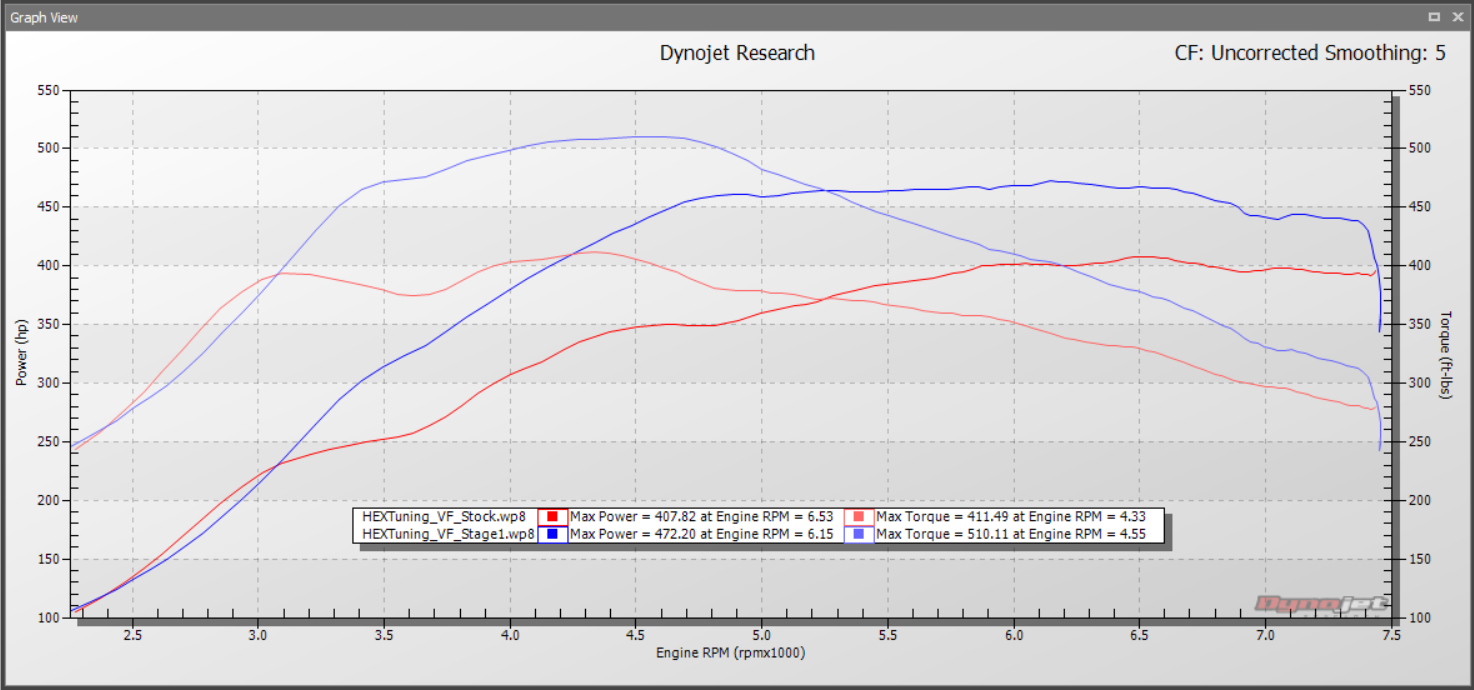
Last edited by VF-Engineering; 02-16-2017 at 07:07 PM.. |
|
Appreciate
6
|
| 12-22-2016, 07:26 PM | #3 |
|
General
 
21117
Rep 20,741
Posts
Drives: 2021 911 turbo
Join Date: Jan 2012
Location: Montreal
|
 I read respectable scientific integrity here 
__________________
Porsche 911 turbo 2021 992 GT Silver
 Previous cars: M4cs 2019 F82 Limerock Grey / M4 2015 F82 Silverstone / M3 2008 E92 Silverstone / M3 2002 E46 Carbon Black |
|
Appreciate
1
VF-Engineering1008.50 |
| 12-22-2016, 08:38 PM | #4 |
|
Captain
 345
Rep 966
Posts |
This is an awesome post.
Something that MANY car performance forums need to read and understand. I'm glad VF took the time to explain this in plenty of detail. |
|
Appreciate
2
VF-Engineering1008.50 FSociety3812.50 |
| 12-23-2016, 01:04 PM | #5 |
|
Major
1009
Rep 1,388
Posts |
Thanks guys! Last edited by VF-Engineering; 12-23-2016 at 03:40 PM.. Reason: Edited based on advice from moderator after "flagged post". |
|
Appreciate
0
|
| 12-23-2016, 08:56 PM | #7 | |
|
Banned
119
Rep 180
Posts |
Quote:
It's nice to see a product that delivers beyond what's promised. And we've seen nothing but consistent results from east and west coast customers on the dyno and at the drag strip. |
|
|
Appreciate
0
|
| 12-28-2016, 11:42 PM | #8 |
|
Brigadier General


394
Rep 3,161
Posts |
Great post!
__________________
2015 M3 BPM Tuned, Eibach, Magnaflow and more www.tmrmzine.com/m3/f80
SOLD E92 Slēk Carbon Fiber Widebody M3 www.tmrmzine.com/m3/slek/ SOLD E92 335i Stage 3+ with all the toys www.tmrmzine.com/335/ SOLD E39 M5 Modded, What a great car! www.tmrmzine.com/m5/ |
|
Appreciate
0
|
| 12-30-2016, 11:49 AM | #10 |
|
Major
1009
Rep 1,388
Posts |
Thanks guys. (RIGHT Lane) |
|
Appreciate
0
|
| 01-06-2017, 02:12 PM | #11 |
|
Private

118
Rep 61
Posts |
This is why we love HEX Tuning!
We signed on with them at the end of last year and they have been awesome to work with. They seem to love sharing data and helping us educate our customers so they make smart decisions when modifying their car, even when it's not just in regards to their own software. |
|
Appreciate
2
VF-Engineering1008.50 psuwcc112443.50 |
| 01-07-2017, 09:25 AM | #12 |
|
Private First Class
 67
Rep 172
Posts |
I got my stage one @ 30k miles. I'm @ 55k miles and couldn't be happier.
If there are any new updates pls keep us posted |
|
Appreciate
1
VF-Engineering1008.50 |
| 01-08-2017, 12:32 AM | #13 |
|
IG @bmwF9xG80
3813
Rep 7,593
Posts
Drives: G80 M3, X4M, G07 X7m50
Join Date: Apr 2012
Location: NYC to NJ to Orlando FL
|
Looking forward on the Topic "AUC" "Area Under The Curve" as most ppl only see peak gains not the AUC
__________________
60-130mph 6.5s X4M #HCP
60-130mph 5.0s G80 M3 #OrlandoAutowerks Sauce IG: @bmwF9XG80  |
|
Appreciate
0
|
| 01-09-2017, 10:59 AM | #14 |
|
Major
1009
Rep 1,388
Posts |
Lets face it, the numbers matter. The purpose of modding your car is to improve upon 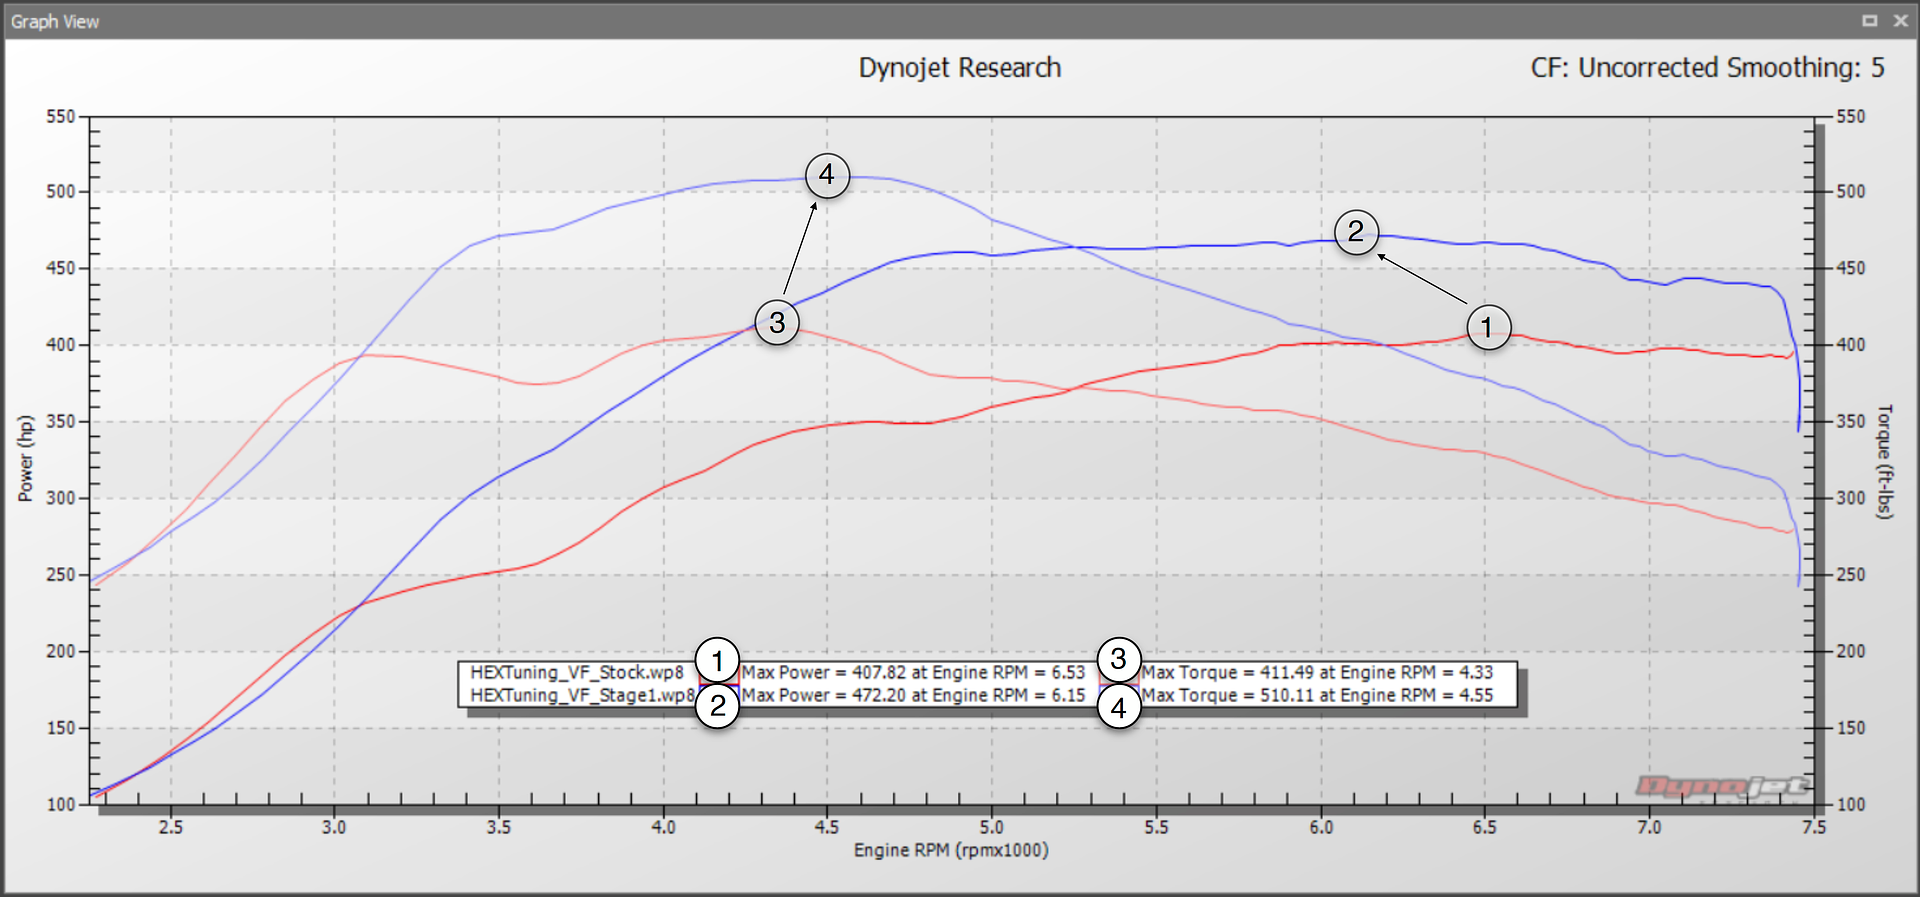 1) Stock Horsepower: 407.82The results here show a Peak Gain of 64 Horsepower and 98 Ft. Lbs. of Torque for our 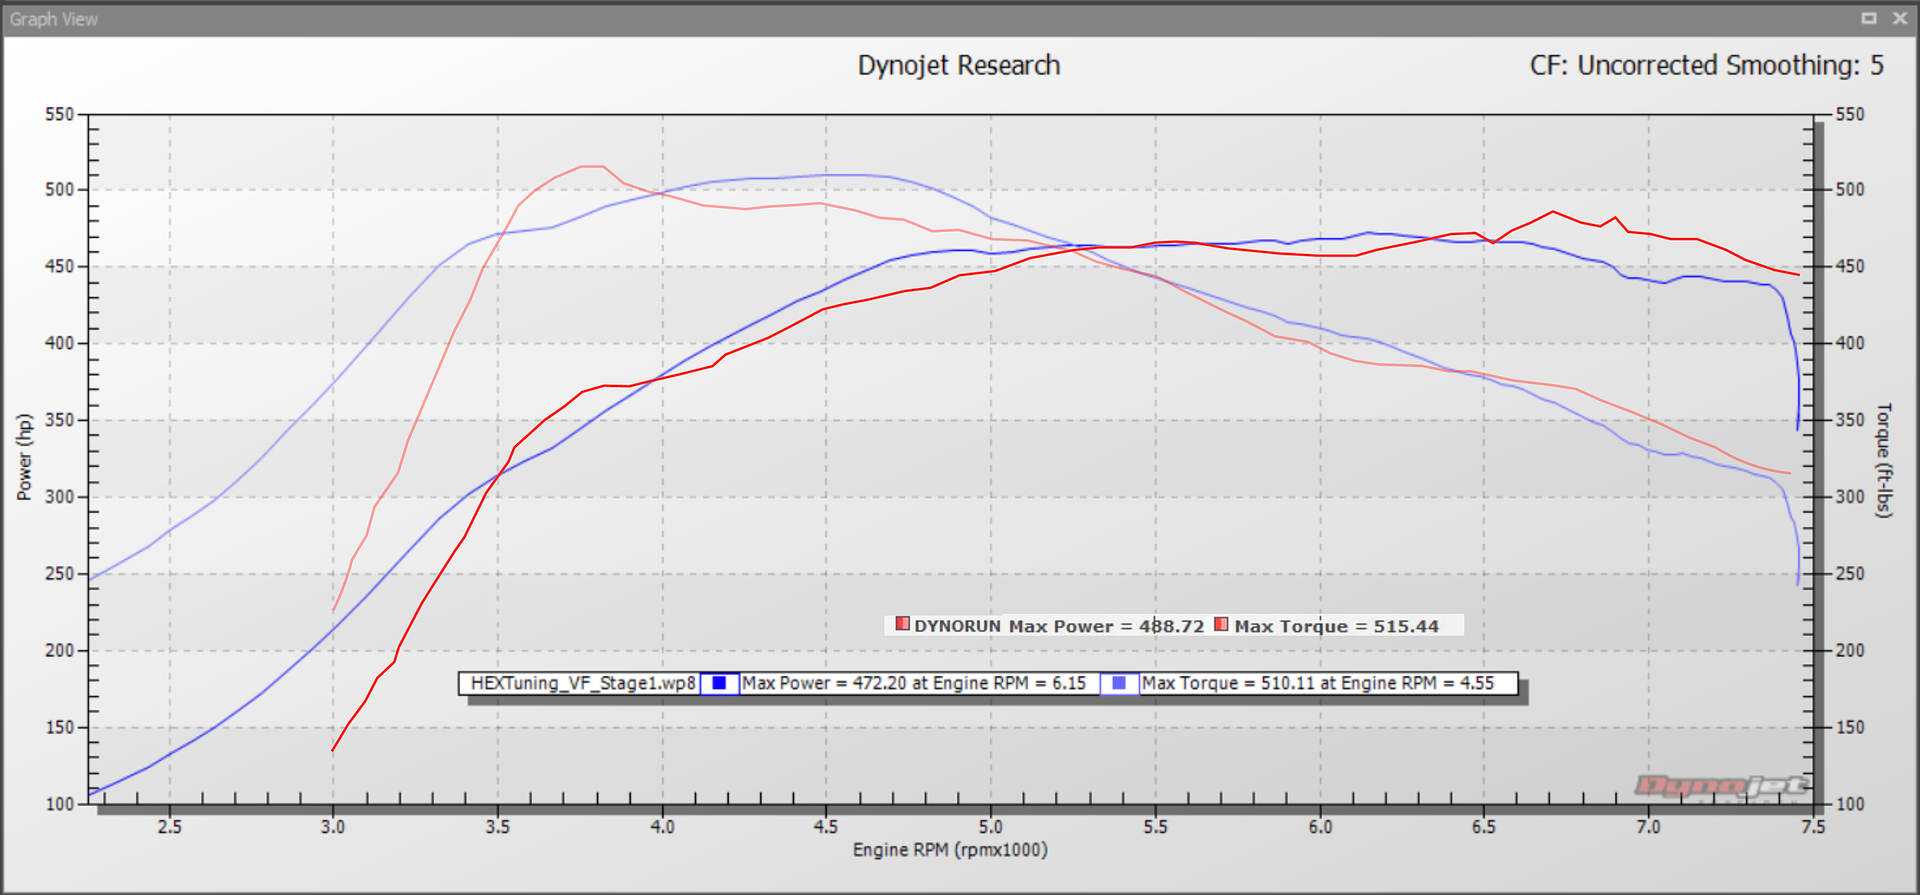 And in referring back to our first post at the top of this page, imagine if thoseThe more context you offer, the more you start to see that peak numbers 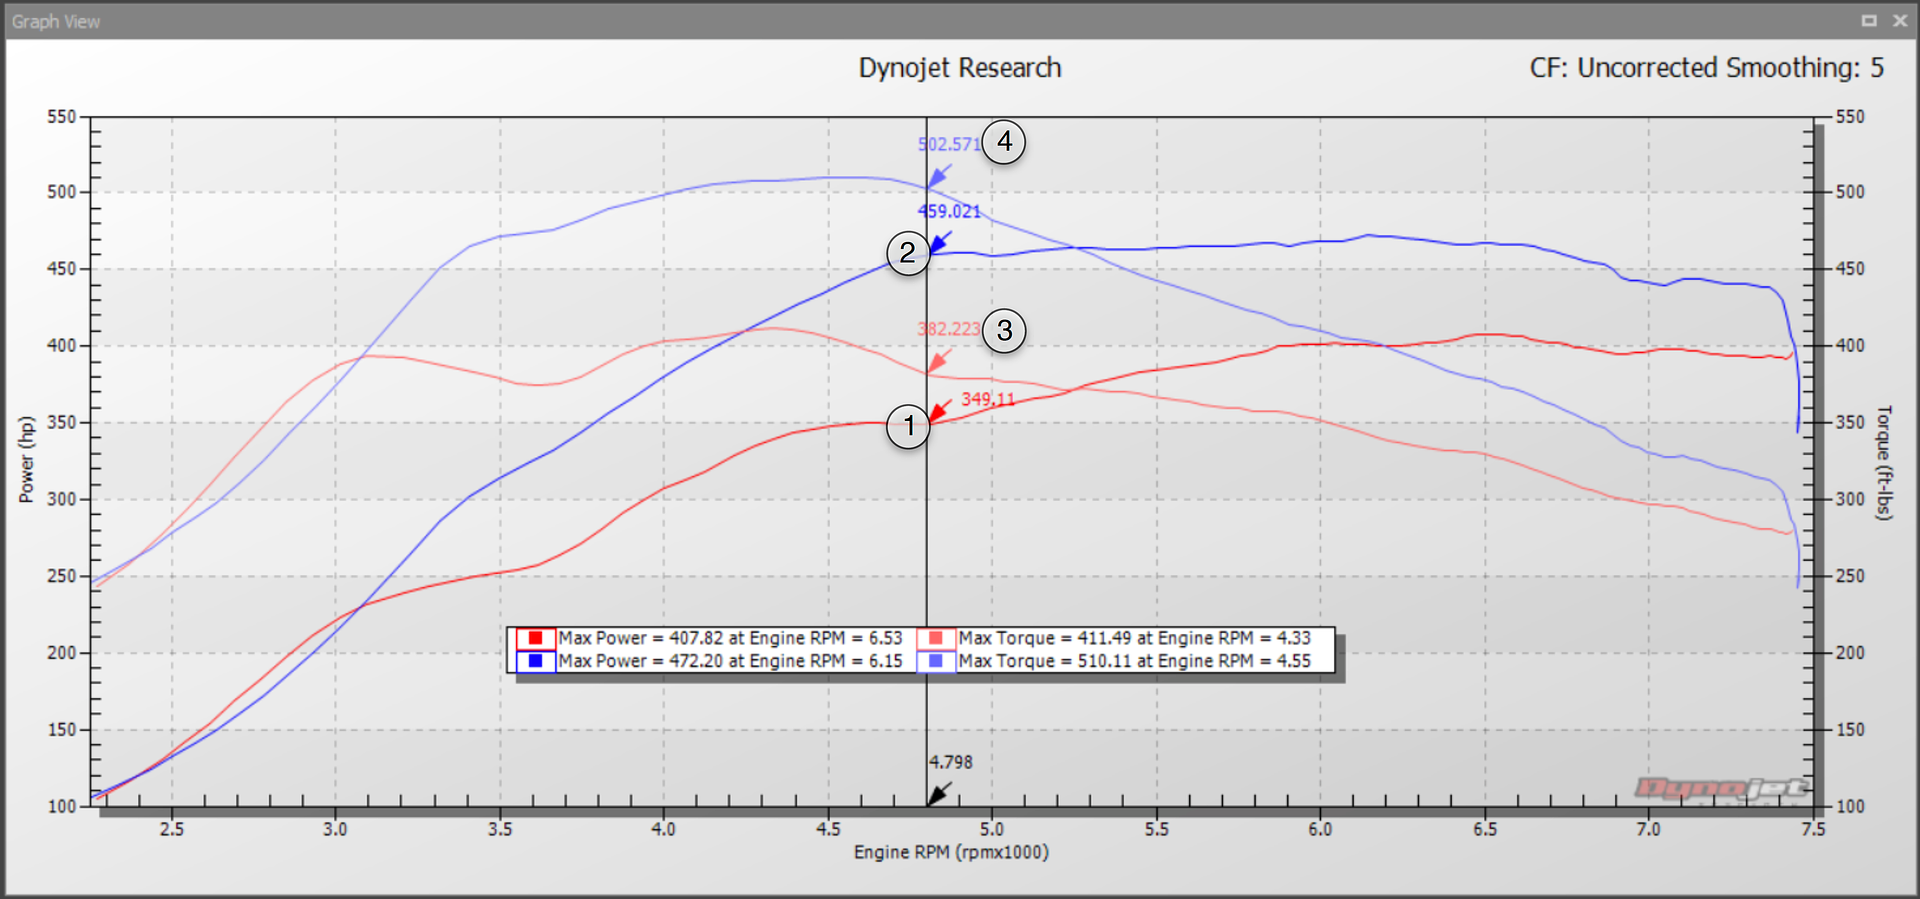 1) Stock Horsepower: 349.11Impressive, right?! 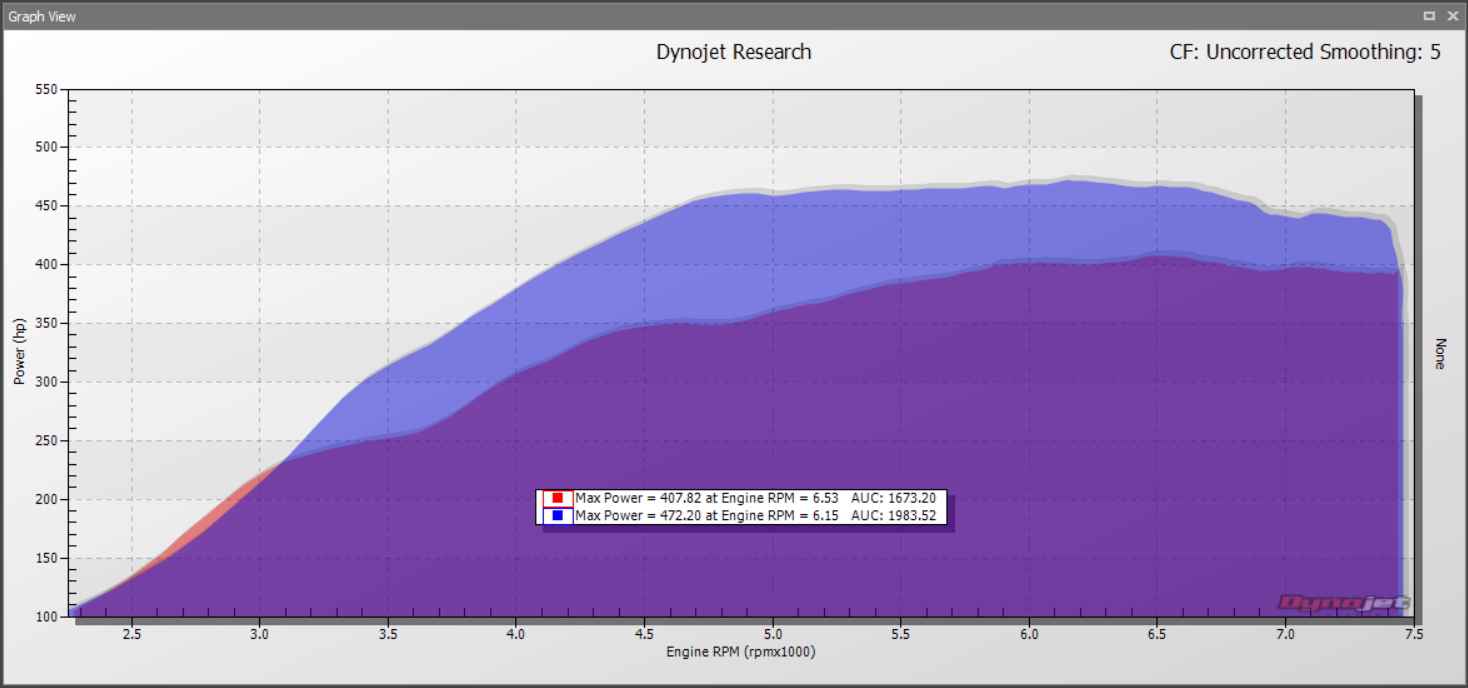 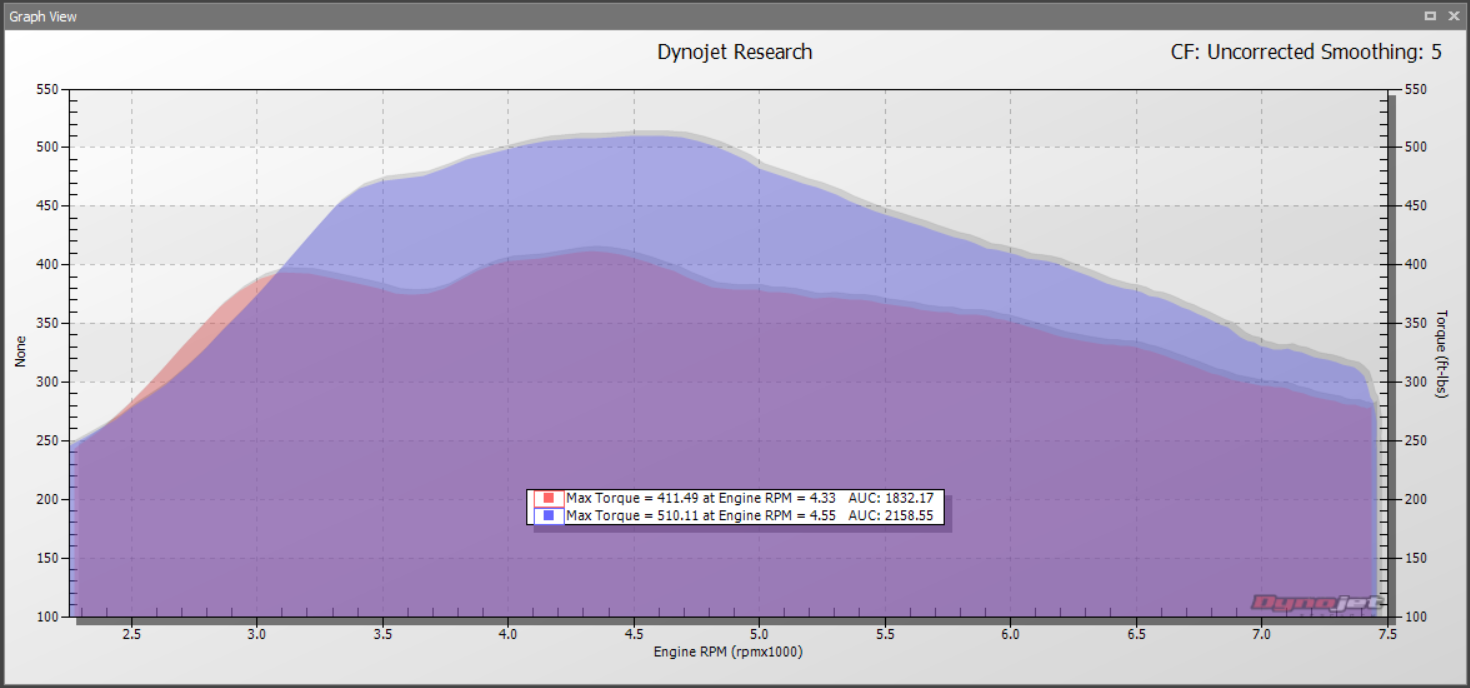 Simply put, the visible "blue" area represents your total volume of gains over stock. |
|
|
| 01-09-2017, 11:41 AM | #15 |
|
Brigadier General

4859
Rep 3,659
Posts
Drives: 981 Cayman GTS
Join Date: Mar 2015
Location: CA
|
^ Nice job! VF-Engineering
|
|
Appreciate
1
VF-Engineering1008.50 |
| 01-09-2017, 12:16 PM | #16 | |
|
.

660
Rep 1,059
Posts |
Quote:
|
|
|
Appreciate
1
VF-Engineering1008.50 |
| 01-09-2017, 02:20 PM | #17 |
|
Brigadier General
4859
Rep 3,659
Posts
Drives: 981 Cayman GTS
Join Date: Mar 2015
Location: CA
|
I have a question related to Area Under Curve (AOC). It seems that VF tune is behind the stock tune up until 3100 RPM in terms of both HP and Torque. After 3100 RPM, it catches up and leaves the stock tune behind. Why is it underperforming compared to stock under 3100 RPM?
I know the difference in both power and torque graphs is very minimal but still curious. P.S. I don't know if it's just because of the run or there is another factor into it. I literally don't know and just trying to learn. |
|
Appreciate
0
|
| 01-09-2017, 04:28 PM | #19 | |
|
Major
1009
Rep 1,388
Posts |
Quote:
That's a good question. |
|
|
Appreciate
1
M-Pilot4859.00 |
| 01-09-2017, 04:47 PM | #20 | |
|
Major
1009
Rep 1,388
Posts |
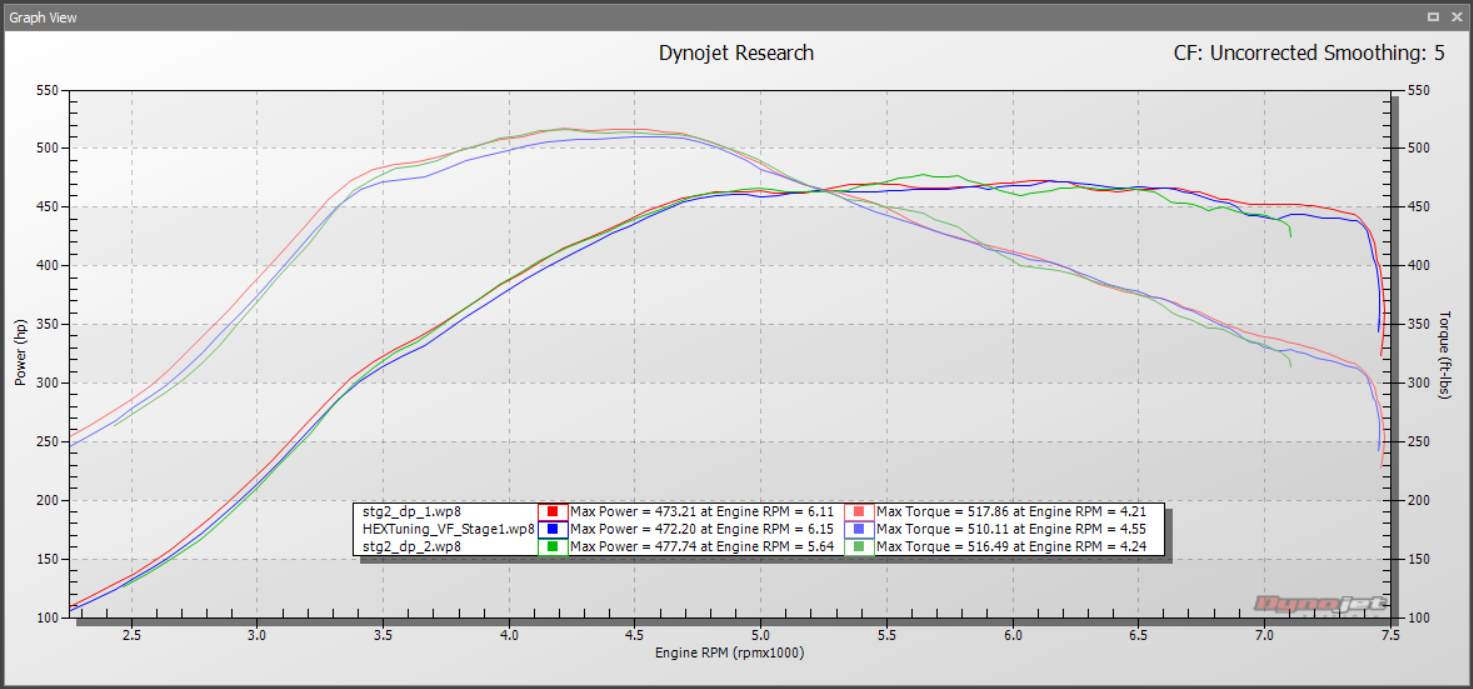
Quote:
Here's a good actual example of our Stage ONE vs. Stage TWO, 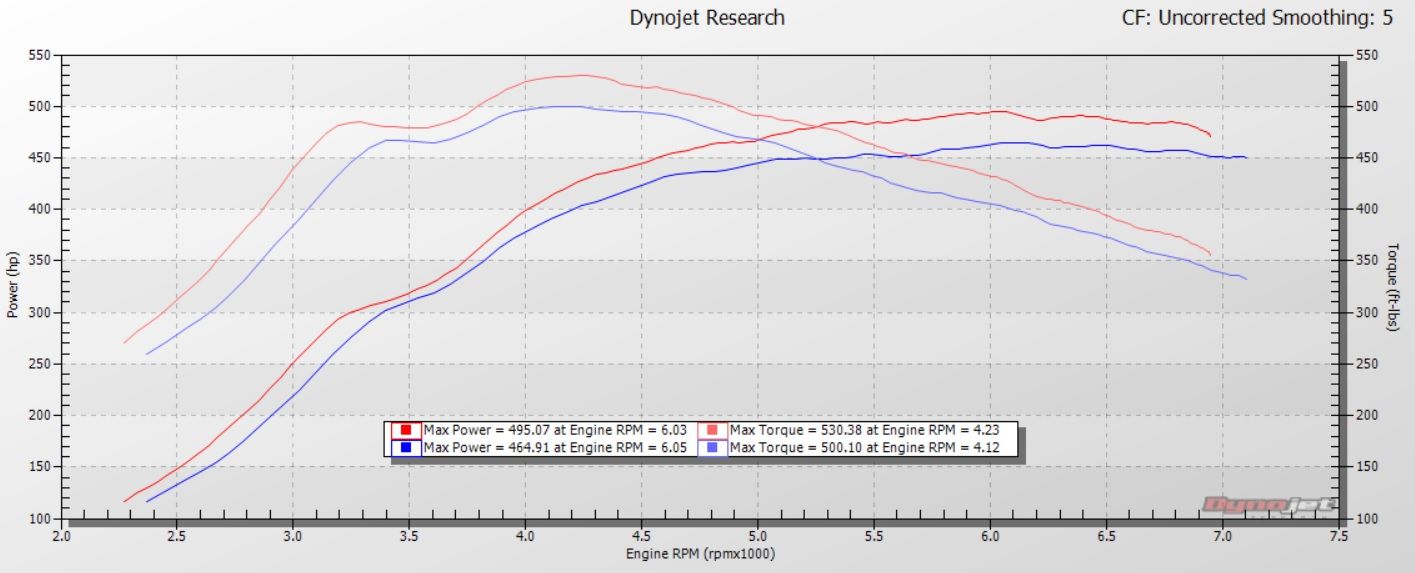 We advertise a gain of 10-20 WHP and 15-25 WTQ when going Once again, these are Uncorrected numbers with Smoothing: 5 |
|
|
Appreciate
1
qspring105.00 |
| 01-09-2017, 05:16 PM | #21 | |
|
Brigadier General
4859
Rep 3,659
Posts
Drives: 981 Cayman GTS
Join Date: Mar 2015
Location: CA
|
Quote:
 |
|
|
Appreciate
1
VF-Engineering1008.50 |
| 01-10-2017, 08:33 PM | #22 |
|
Second Lieutenant
75
Rep 201
Posts |
VF HEX and TCU FTWWWW!!! LOVE it
|
|
Appreciate
1
VF-Engineering1008.50 |
 |
| Bookmarks |
|
|


